Cinemas in Strasbourg

This post deals with the evolution of cinemas in Strasbourg. Today, there exist five movie theaters in the city of Strasbourg:
- Star
- Star Saint-Exupéry
- Cinéma Vox
- Odyssée
- UGC Ciné Cité Strasbourg Etoile
You can find them on the following map:
But how did the cinema landscape evolve over the last years in Strasbourg? Appropriate data to answer this question comes from the Centre national du cinéma et de l’image animée (CNC) and is available on the French open data platform data.gouv.fr (or can be downloaded here).
As usual, we start by loading the necessary packages.
# Load packages
library(tidyverse)
library(readxl)
library(nominatim)
library(leaflet)
Next, we define some helper functions for cleaning and preparing the data in the original Excel file.
# Define functions

## Load sheets from Excel file
load_sheet <- function(sheet_name, i){
  path <- "/home/david/Documents/GitHub/chodera.github.io/assets/projects/6. Cinemas in Strasbourg/"
  sheet_name <- read_excel(str_c(path, "exploitation - données par commune.xlsx"), sheet = sheet_name, skip = i)
}

## Tidy sheets
clean_sheet <- function(sheet){
  # Get name of data frame
  df_name <- deparse(substitute(sheet))

  sheet <- sheet %>%
    # Rename columns
    rename(code = "...1",
           city = "...2") %>%
    # Filter for Strasbourg
    filter(city == "Strasbourg") %>%
    gather(c("1960":"2017"), key = "year", value = "col") %>%
    select(-c(code, city)) %>%
    mutate(year = as.numeric(year))

  # Set correct column name
  names(sheet)[names(sheet) == "col"] <- df_name

  # Assign changed data frame to original data frame
  assign(df_name, sheet, envir = .GlobalEnv)
}

## Set correct column names
set_col <- function(list, names){
  for (i in 1:length(list)){
    names(list[[i]])[[2]] <- sheet_names[[i]]
  }
  return(list)
}
Now we are ready to load and wrangle with the data.
# Load data
number_of_cinemas <- load_sheet("établissements", 6)
screens <- load_sheet("écrans", 6)
seats <- load_sheet("fauteuils", 6)
multiplex <- load_sheet("multiplexes", 6)
showing <- load_sheet("séances", 6)
entries <- load_sheet("entrées", 6)
revenue <- load_sheet("recettes", 6)
avg_rev_per_entry <- load_sheet("RME", 6)
frequentation_index <- load_sheet("indice de fréquentation", 8)
occupancy_rate <- load_sheet("taux d'occupation des fauteuils", 6)

# Assign sheet_names to a vector
sheet_names <- c("number_of_cinemas",
                 "screens",
                 "seats",
                 "multiplex",
                 "showing",
                 "entries",
                 "revenue",
                 "avg_rev_per_entry",
                 "frequentation_index",
                 "occupancy_rate")

# Assign data frames to a list
data <- list(number_of_cinemas,
             screens,
             seats,
             multiplex,
             showing,
             entries,
             revenue,
             avg_rev_per_entry,
             frequentation_index,
             occupancy_rate)
names(data) <- sheet_names

# Clean data
clean_data <- map(data, clean_sheet) %>%
  set_col(sheet_names)

# Join data frames
cinemas_stras <- left_join(clean_data$number_of_cinemas, clean_data$screens, by = "year") %>%
  left_join(., clean_data$seats, by = "year") %>%
  left_join(., clean_data$multiplex, by = "year") %>%
  left_join(., clean_data$showing, by = "year") %>%
  left_join(., clean_data$entries, by = "year") %>%
  left_join(., clean_data$revenue, by = "year") %>%
  left_join(., clean_data$avg_rev_per_entry, by = "year") %>%
  left_join(., clean_data$frequentation_index, by = "year") %>%
  left_join(., clean_data$occupancy_rate, by = "year")

# Remove separate data frames
rm(list = c(sheet_names, "clean_data", "data"))
After having prepared the data we will analyze the evolution of cinemas in Strasbourg with the help of data visualizations. First, we display the number of cinemas over time. Data is available from 1992.
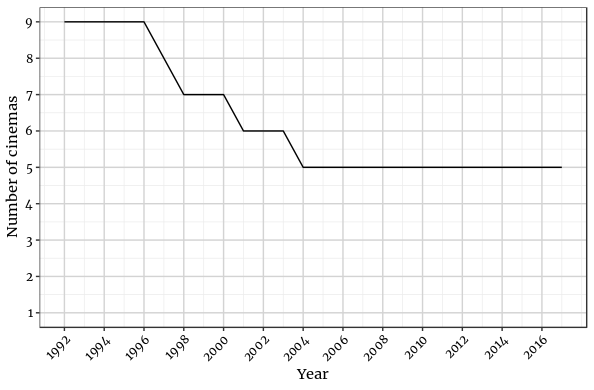
A clear downward trend is to be noticed. In 1992, there were 9 cinemas in the city and the number continuously diminished down to 5. However, since 2004, the number remained at this level. Did the reduction actually correspond to less people going to the movies?
The following graph visualizes different additional indicators, including information on the number of entries, screens, movies shown, revenue, and occupancy rate. A striking impact on the evolution of cinemas in Strasbourg had the opening of the first (and until today the only) multiplex cinema in 1999 (cf. the red vertical line). All at once, the number of seats nearly doubled. Consequently, there were more screens available and more movies shown from then on. However, the number of entries did not increase as much. Nevertheless, it reached its peak in 2011 with around 2.5 millions entries and is slightly decreasing since then. Revenues follow this overall trend.
The occupancy rate is defined as the ratio between the number of seats entered during the year and the product between the number of seats and the number of sessions. It enables to evaluate the “filling” of the rooms. The corresponding graph shows a significant drop in the occupancy rate after the multiplex cinema opened which is related to the increased offer of seats. However, in the 2000s, there was a slight increase in the filling of cinemas.
Although the number of movie theaters continuously decreased since the 1990s, it cannot be concluded that the opening of the multiplex cinema destroyed the market for smaller, independent cinemas. People in Strasbourg (me included!) still benefit from cinemas that offer a program which is not dominated by big-budget Hollywood productions. It is only to be hoped that the slight negative trend of the number of entries in the 2010s does not continue in the next years.
Get the full code here.